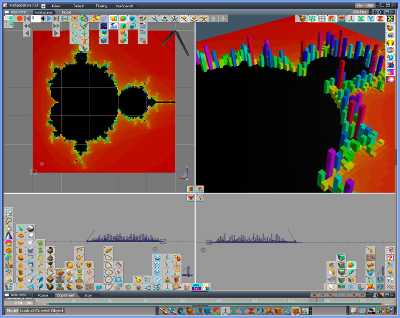
This script gives a demonstration of plotting Mandelbrot set and coloring trueSpace (tS) objects. Each pixel's color and height are calculated by x and y coordinates of the point using Python's "complex" type. To get a spectrum of color in RGB, the script uses hsv_to_rgb() of "colorsys" standard module.
You may change some parameter for the range, precision, etc. to get result you want, but too high precision may cause tS crash.
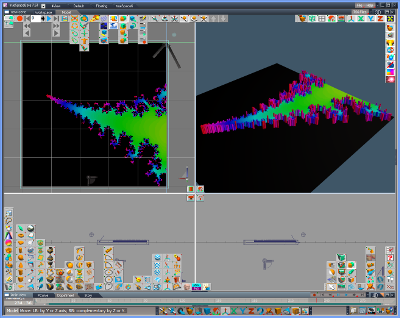
edited on Mar 12 2019:
This script cannot run with Python2. Please use ptsxpy-for-Python3.
Updated the attached script file, 1b->1c so that it can be run with ptsxpy 0.0.7.
Mandelbrot plot (2002)
- 3DfromNULL
- Site Admin
- Posts: 45
- Joined: 2018-Jul-13 9:35
Mandelbrot plot (2002)
- Attachments
-
- mandel1c.py
- script file
- (2.63 KiB) Downloaded 2397 times